|
|
Hurricane pictures / summaries 2015
Satellite images provided by NOAA / NASA / MODIS. Hurricane tracks courtesy of the National Hurricane Center.
 Click pictures for close up view Click pictures for close up view
|
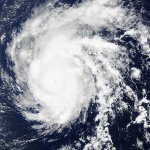
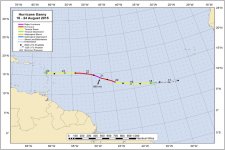
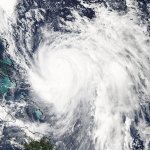
Hurricane Danny
August 21, 2015
Danny was a tropical cyclone that strengthened and weakened rapidly during its lifecycle. This was due to dry intrusions of air from the SAL or Saharan Air Layer. Danny was classified as a tropical storm several hundred miles southwest of the Cape Verde Islands on August 18th. It gained maximum strength as a major hurricane on the 21st at 960 mb with a wind of 125 mph. Danny began a weakening phase shortly thereafter and weakened to a tropical depression as it moved into the northeastern Caribben. There was no damage associted with Danny.
|
|
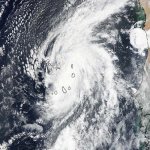
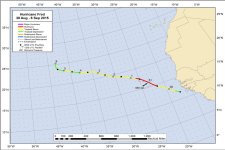
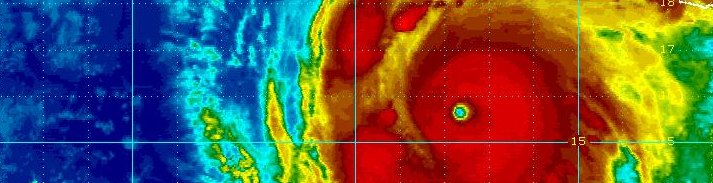
Hurricane Fred
August 31, 2015
Fred took an unusual path for a tropical cyclone. It formed almost immediately offshore of Africa from a tropical wave and reached tropical storm strength on August 30th. A weakness in the subtropical ridge allowed Fred to track northwest into the eastern Cape Verde Islands. Fred was estimated to have 85 mph top sustained winds. No official reports are available to verify the actual intensity. Nine fatalities were attributed to Fred from a ship that capsized. Approximately one million dollars in crop damage occured in Guinea-Bissau from storm surge.
|
|
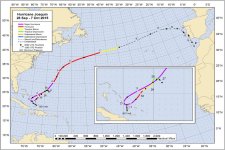
Hurricane Joaquin
October 1, 2015
Hurricane Joaquin will be remembered for causing devastation to the east-central Bahamas and the sinking of the cargo ship El Faro. In total, 34 people lost their lives from Joaquin. Joaquin originated from an upper air low pressure system that drifted across the Atlantic ocean. The low gained tropical characteristics northeast of San Salvador, Bahamas where it was classified as a tropical storm on September 28th.
A building ridge of high pressure forced the system southwest until a trough over the eastern U.S. caused a turn to the north by the first few days of October. The weak steering currents combined with very warm water temperatures allowed for the hurricane to gain strength and remain very close to the eastern Bahamas for at least two days. Joaquin was at its lowest pressure near the east central Bahamas with a 931 mb pressure. The strongest winds occured as Joaquin moved northeast with sustained winds of 155 mph. It continued across the north Atlantic and eventually became extratropical near Portugal. Joaquin was the strongest hurricane to form from a non-tropical origin during the satellite era.
The effects of Joaquin were widespread. Storm surge of up to 15 feet were measured on Rum Cay, San Salvador, Crooked Island, and Acklins. Heavy rainfall affected the southeast U.S. coast where nearly 27 inches of rain fell at Mt. Pleasant, SC. The eastern Bahamas sustained the most damage with flooded roads, downed power lines and trees and damaged homes and airports.
|

|
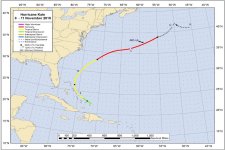
Hurricane Kate
November 11, 2015
Kate developed from a late season tropical wave. Wind shear weakened near the Turks and Caicos and Kate became a tropical storm on November 9th. Kate accelerated to the northeast between the coast of North Carolina and Bermuda. Top sustained winds of 85 mph were estimated on the 11th. There was no damage reported with Kate.
|
Hurricane pictures and summaries main page.
|
|
|
)
)
)
)
)
)
)
)